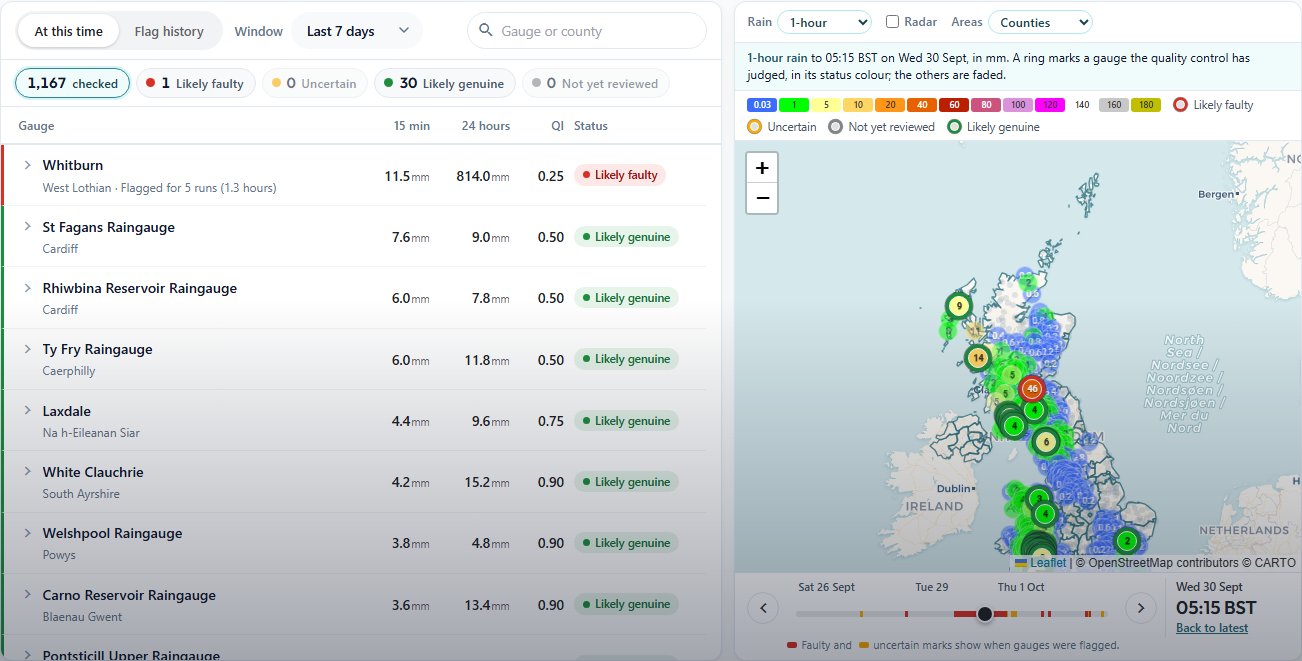
A new page checks every rain gauge across Great Britain every 15 minutes against its neighbours, the radar and its own recent readings. The map shows rainfall as usual, and any gauge that has had a second look wears a ring: red for likely faulty, amber for uncertain, green for a real shower the neighbours missed. It also picks out blocked gauges that read nothing while it rains all around them. Open a gauge in the list to see why, with its readings beside the radar.
The Flood Forecasting Centre and the Met Office now share one impact matrix, so Flood Guidance Statements use new names: impact runs Minor, Moderate, Significant, Extreme (was Minimal, Minor, Significant, Severe) and likelihood Low, Medium, High, Very high. The colours and overall risk levels are unchanged, and the whole site, archive included, now uses the new names. Weather warnings are now labelled by their colour (Yellow, Amber, Red) rather than Moderate, Severe and Extreme, which are matrix words now.
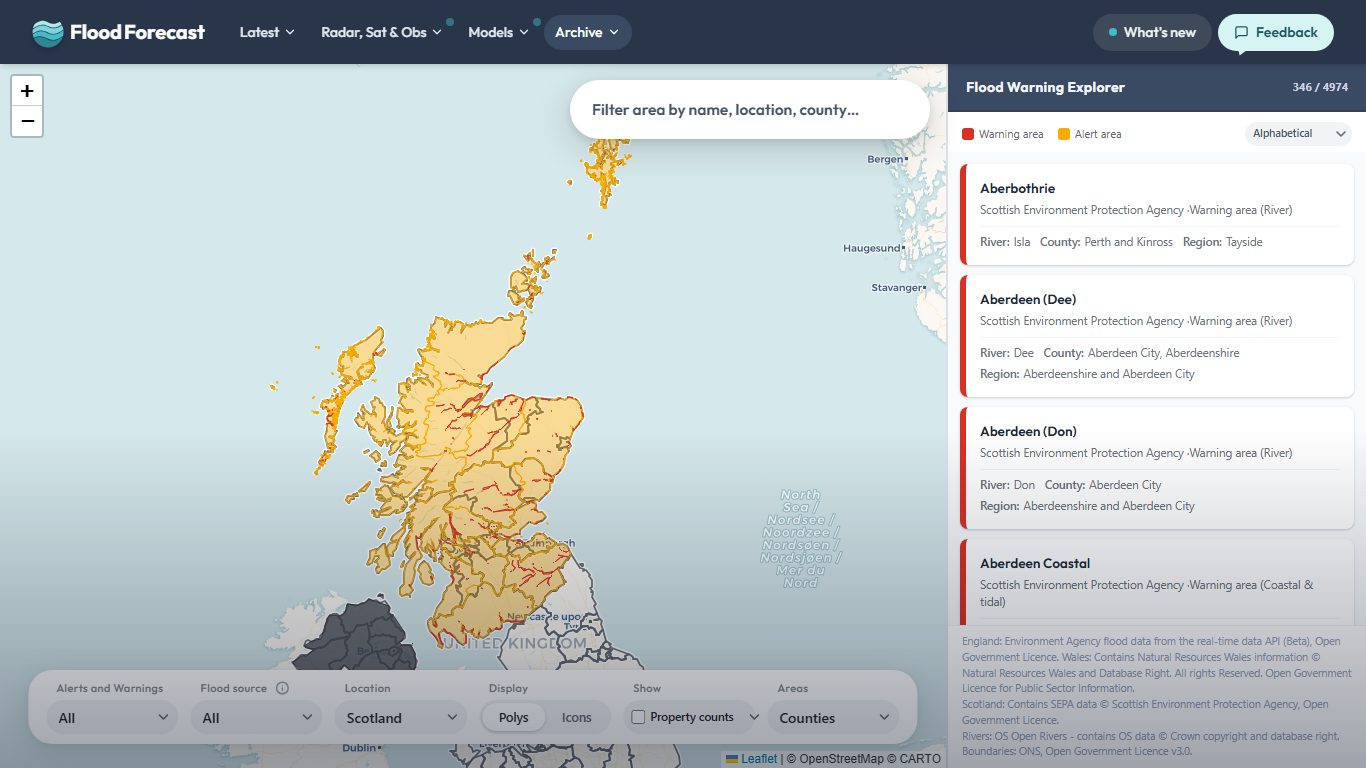
The flood warnings map and the homepage now include SEPA's live flood warnings and alerts for Scotland, alongside England and Wales, and the Flood Warning Explorer maps all 346 of Scotland's flood warning and alert areas. Choose Scotland under Location to see it on its own, or scrub the chart to see what was in force earlier.
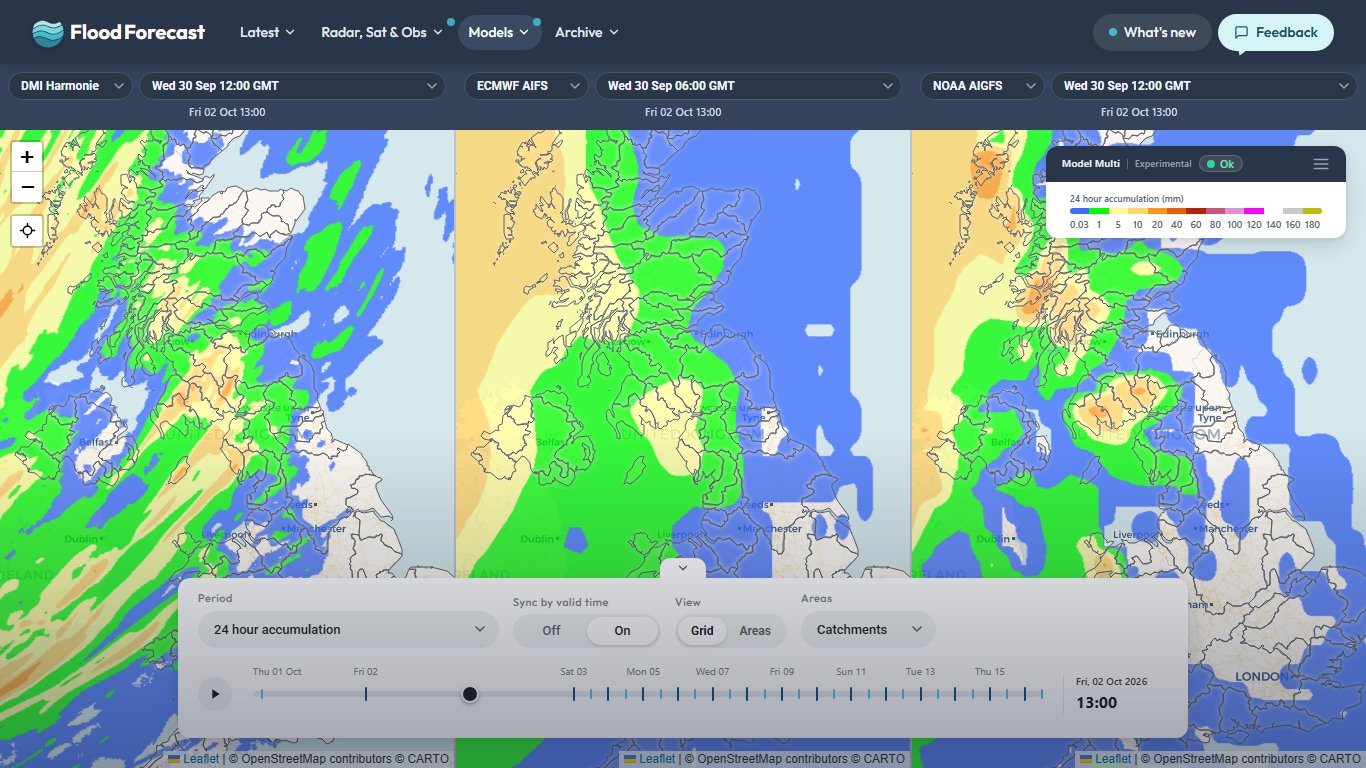
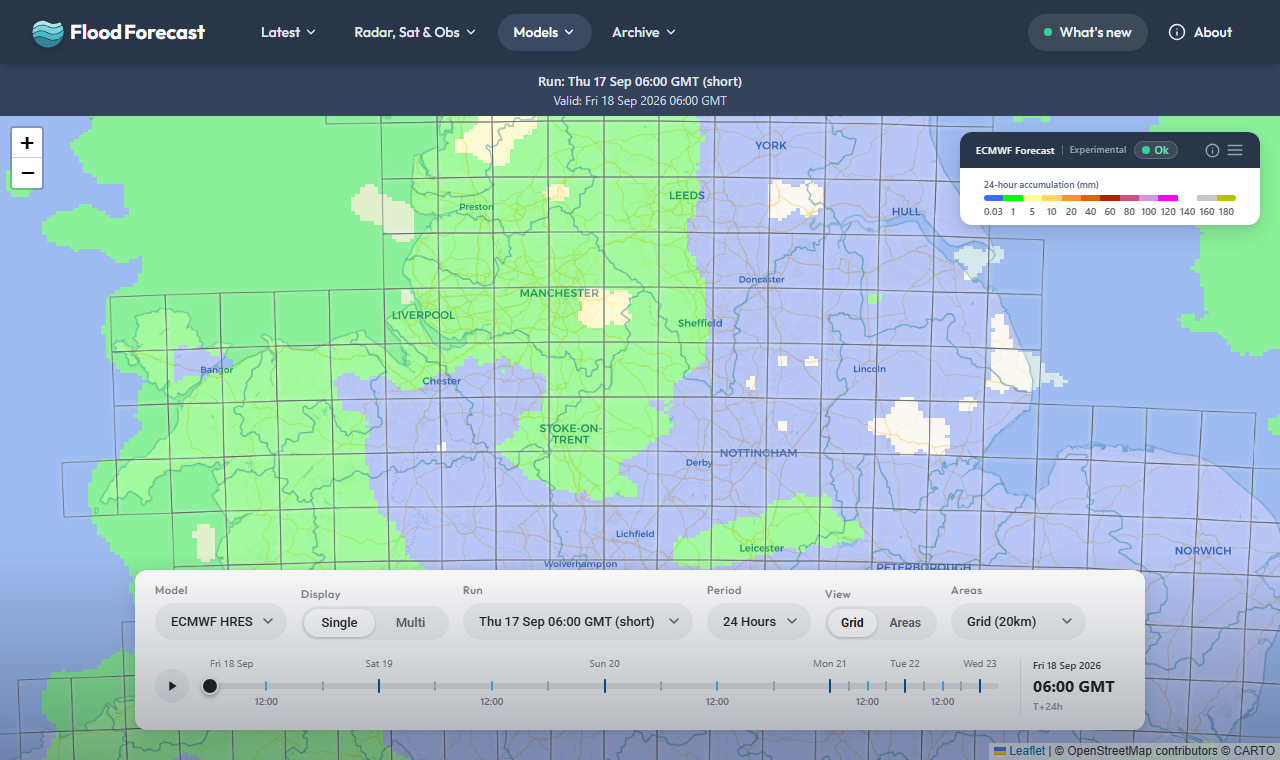
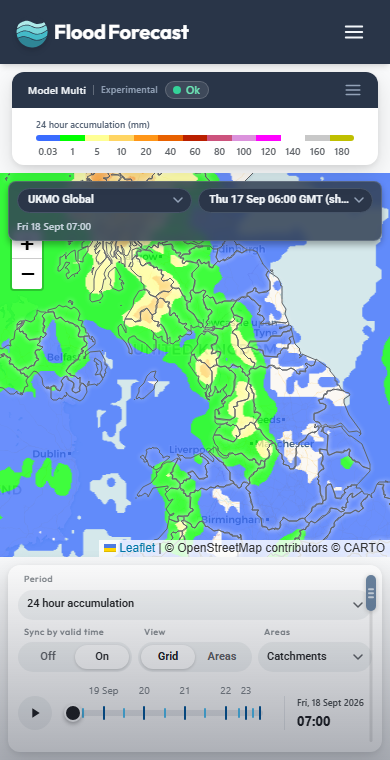
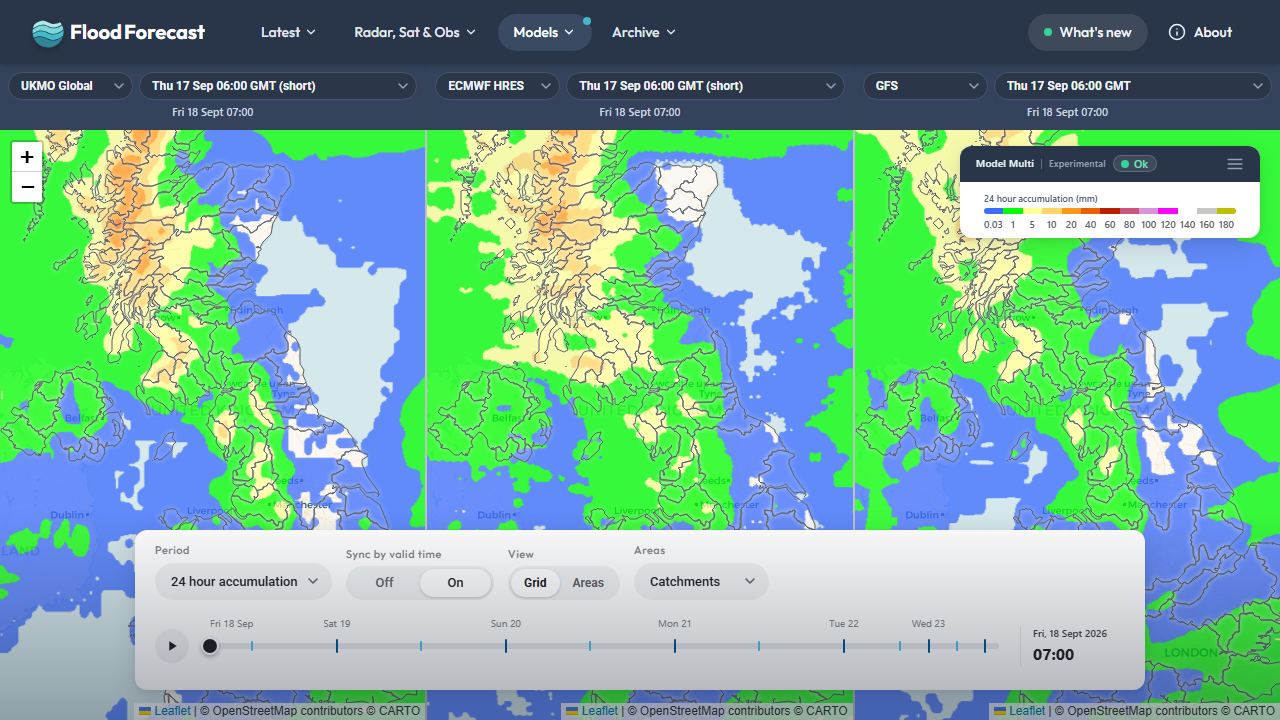
The model viewer and Model Multi now include DMI Harmonie, the Danish Meteorological Institute's 2 km model, for a second high-resolution view of showers and heavy rain beside UKV out to 2.5 days. Two machine-learned models join it: ECMWF AIFS out to 15 days and NOAA AIGFS out to 16, both with isobars, so each can be set against its traditional counterpart, ECMWF HRES and GFS.
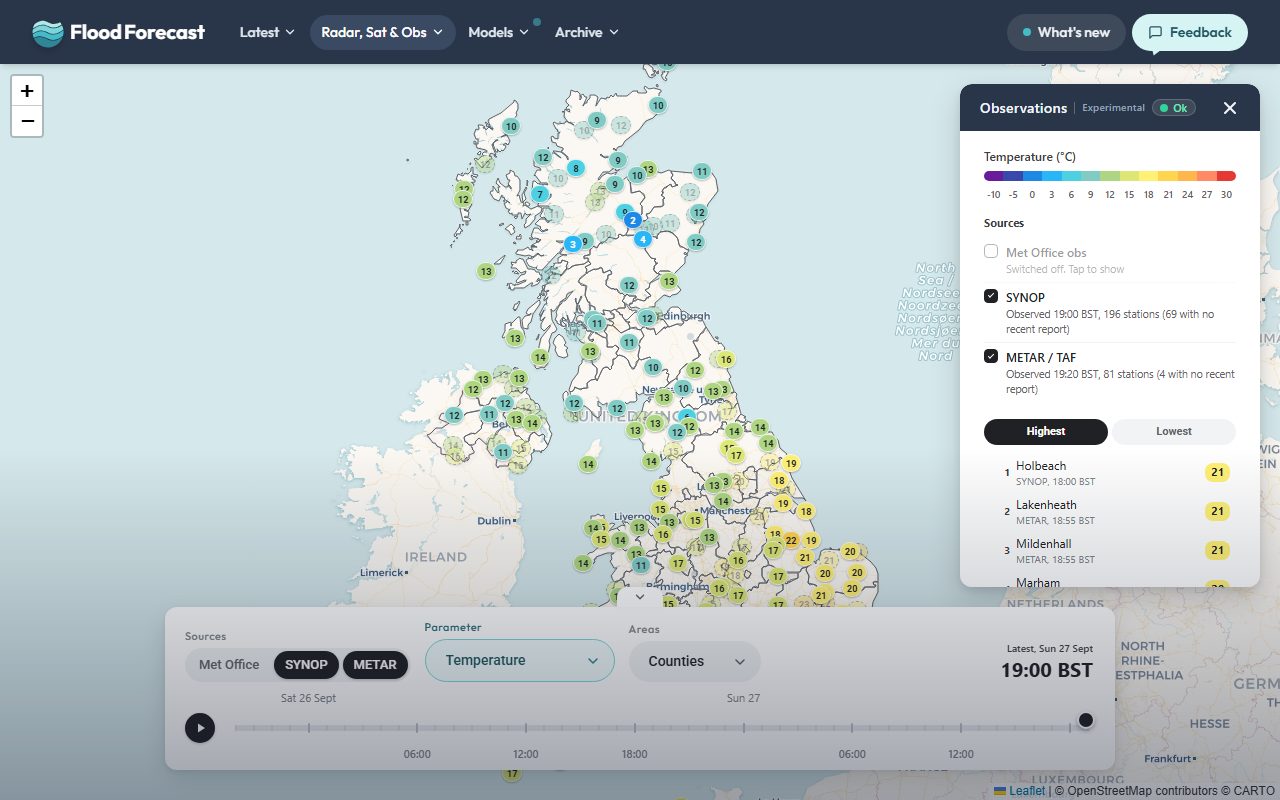
A new map of live UK weather observations: temperature, wind, pressure, humidity, visibility and cloud from SYNOP and METAR reports, with Met Office weather stations to switch on, and the last 48 hours to play back. The homepage has a top ten for any of them.
On the flood warnings map, the location, flood source and severity controls now filter the warnings in force over time chart and the counts too. Picking England or Wales greys out the other country on the map.
The daily Flood Guidance Statement now appears across the site within about ten minutes of being issued, on the home page as well as the flood guidance page.
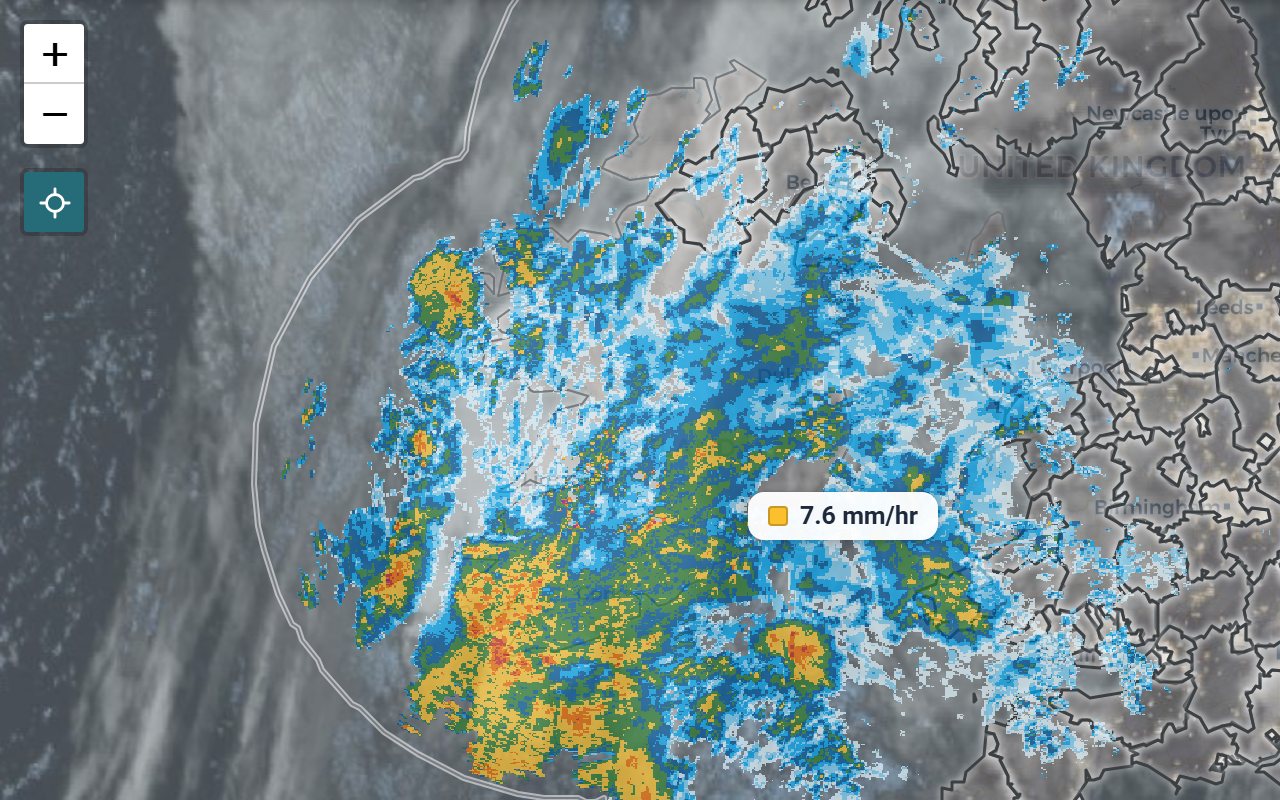
Press the crosshair button under the zoom buttons on the radar, radar accumulation and model maps, then point at the map to read the rainfall at that exact spot, such as 7.6 mm/hr. On a phone a target appears in the middle of the map instead: move the map under it and the reading follows. On the side by side views, pointing at one map reads the same spot on every map. Exact values cover radar frames, accumulations and model runs from 27 September 2026 onwards; earlier ones show the colour band instead, such as 4 to 8 mm/hr.
The controls along the bottom of every map can now be tucked away with the tab on their top edge, leaving one line that says what the map is showing. Tap that line to bring them back. Handy on a phone.
How wet the ground already is at about 50 COSMOS-UK sites across the UK, updated daily, with the last two weeks of soil moisture and rainfall for each site. Wetter ground soaks up less of the next rain. Find it under Latest, in the new Situational Awareness section.
Tap a gauge on the rain gauge map for a chart of hourly rainfall, with 15-minute detail a tap away and the wettest hour labelled. The controls along the bottom can now be tucked away to give the map more room, and a short guide shows how the time slider works.
A new page follows the latest briefing from start to finish: the gauges, radar, forecasts and flood guidance it reads, the maps it looks at, and the rules it writes to. It is linked from the foot of the briefing on the homepage.
The overview page is tidier, with fewer controls and one link per card to the full view. The AI briefing's full text is now split into now, the last 24 hours and the next two days.
SEPA rain gauges across Scotland now report every 15 minutes, the same detail already shown for Environment Agency and Natural Resources Wales gauges. Short-duration rainfall totals (1h, 3h, 6h, 12h) for Scotland are more accurate as a result.
A Theme control at the bottom of every page, and in the phone menu, sets Auto, Light or Dark for the whole site and remembers it. Auto follows your device, as before.
If your phone or computer is set to dark mode, the radar, flood warnings, warning explorer and Met Office warnings pages now follow it, including a dark basemap. Easier on the eyes at three in the morning.
The link button beside Play copies a link to exactly the frame and view on screen, so you can send someone what you are looking at. On every player page the arrow keys now step through frames, Shift with an arrow jumps four, Home and End go to either end, and P or Space plays and pauses.
Zoom in on the radar and the frames are now drawn at twice the detail, with every 1 km radar cell kept. Hover over the map, or tap it on a phone, to read the rainfall rate at that point, and tick Smooth radar in the key panel if you would rather the cells blended than sat as squares.
The 20km grid has no coastline or river in it, so it was hard to tell which square you were looking at. Catchment outlines are now drawn faintly underneath on every map that offers the grid.
The three map panes now stay pinned between the key and the player, so you can scrub through the forecast without scrolling away from the maps. Each pane carries its own model and run picker.
A new page checks every rain gauge across Great Britain every 15 minutes against its neighbours, the radar and its own recent readings. The map shows rainfall as usual, and any gauge that has had a second look wears a ring: red for likely faulty, amber for uncertain, green for a real shower the neighbours missed. It also picks out blocked gauges that read nothing while it rains all around them. Open a gauge in the list to see why, with its readings beside the radar.
The Flood Forecasting Centre and the Met Office now share one impact matrix, so Flood Guidance Statements use new names: impact runs Minor, Moderate, Significant, Extreme (was Minimal, Minor, Significant, Severe) and likelihood Low, Medium, High, Very high. The colours and overall risk levels are unchanged, and the whole site, archive included, now uses the new names. Weather warnings are now labelled by their colour (Yellow, Amber, Red) rather than Moderate, Severe and Extreme, which are matrix words now.
The flood warnings map and the homepage now include SEPA's live flood warnings and alerts for Scotland, alongside England and Wales, and the Flood Warning Explorer maps all 346 of Scotland's flood warning and alert areas. Choose Scotland under Location to see it on its own, or scrub the chart to see what was in force earlier.
This application brings together real-time data from multiple sources to help you stay
informed about weather and flood conditions across the UK.
report_problem
Important
This application is unofficial and provided for informational, research, and analysis purposes only. Uptime, data completeness, and real-time accuracy are not guaranteed.
To avoid over-reliance during active weather or flood events, do not make safety-critical decisions using this tool. For official warnings and instructions, consult the primary public services directly:
Google Analytics is used to see which pages are useful and where the site is slow. It's off until you say otherwise, and your choice is remembered. Nothing else on this site sets non-essential cookies, and advertising or personalisation cookies are never allowed.
Analytics is currently on.
You can change this at any time from the Cookie preferences link in the page footer.