Each station's latest report for the hour shown. Where two
sources sit within 2.5 km of each other (an airfield's METAR
and its own SYNOP, say) they show as one station, and its
popup has every report. Faded, dashed markers are stations
with no recent report when the snapshot was taken.
Catchments: National River Flow Archive (2014). Hydrometric areas for Great Britain and Northern Ireland. NERC-Environmental Information Data Centre doi:10.5285/1957166d-7523-44f4-b279-aa5314163237
Sources
Display
Parameter
Areas
Rivers
Show values
Wind colours
Thank you
Thanks to the person who left feedback about the error on this page. It is now fixed.
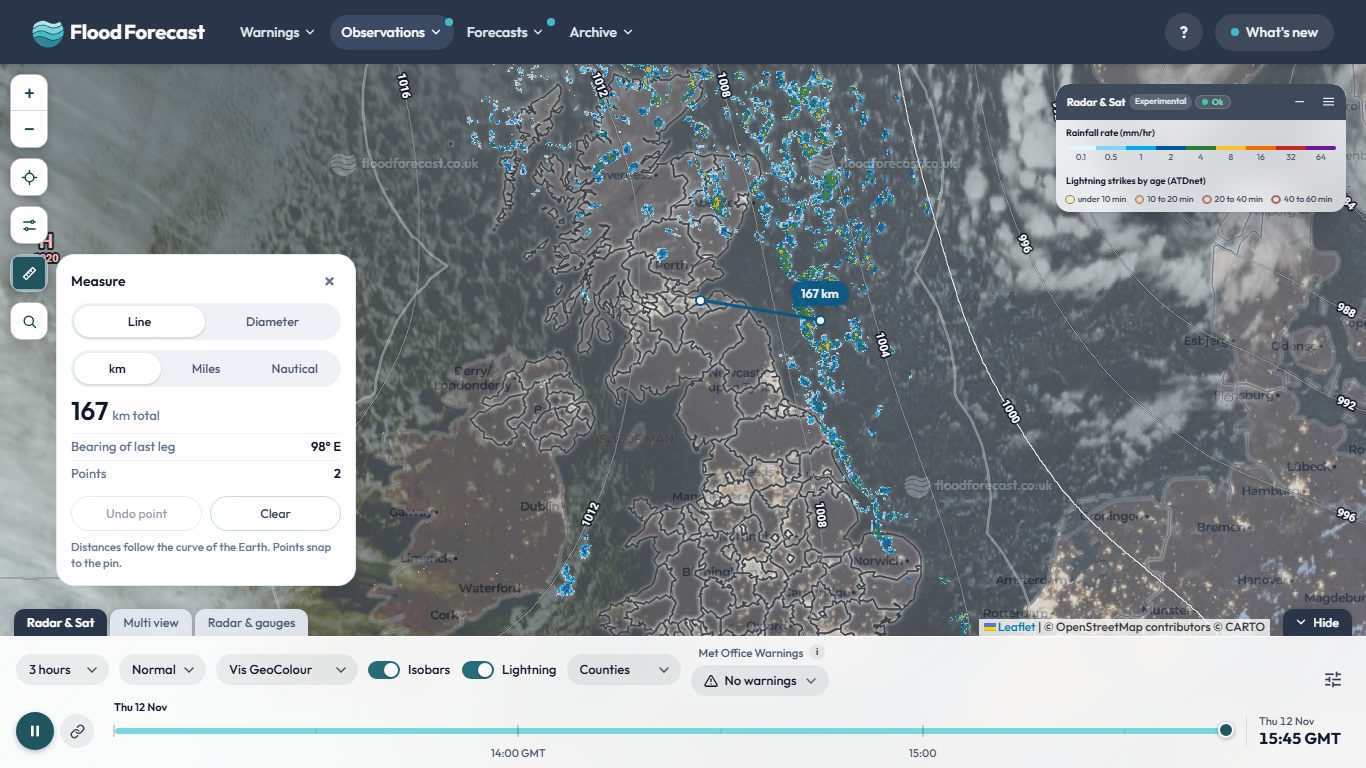
Two new buttons sit at the foot of the map buttons on the radar and model pages. Search finds a town or postcode and drops a pin, or use your location, or press and hold anywhere on the map. Measure draws a line to give the distance and bearing, or choose Diameter to click a centre and an edge and read the radius, diameter and area. Distances can be in km, miles or nautical miles, and points snap to your pin.
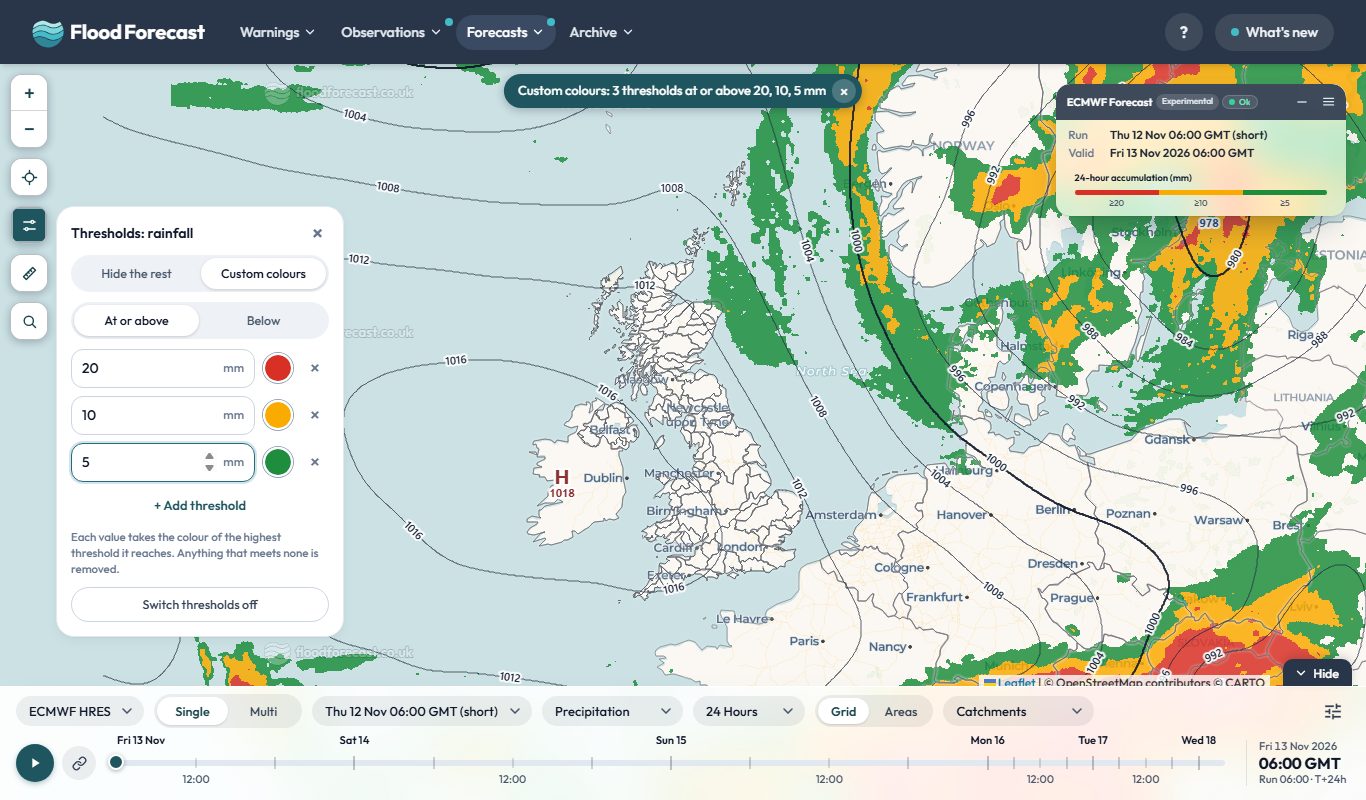
A new button under the zoom buttons lets you set a level and show only what meets it, such as rain at or above 30 mm or gusts below a given speed. Or choose Custom colours to give each level its own colour, for example red from 30, amber from 20 and green from 10. A pill at the top of the map says when thresholds are on, and the key shows your levels. It works on weather observations, the Model Viewer and Model Multi (rain and wind), Radar and Radar Accumulation.
A new homepage: what has happened, and what is coming
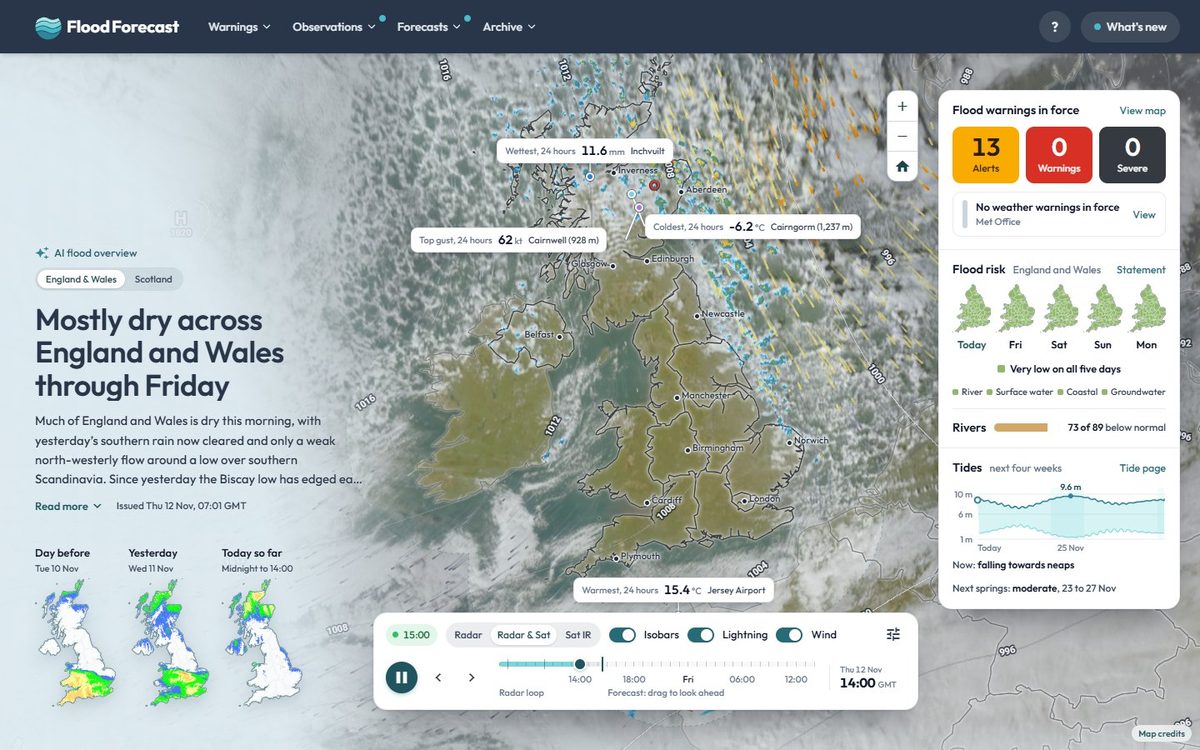
The homepage now reads as a timeline. The live radar and satellite loop leads, and you can drag its slider past now into the next 24 hours of Met Office UKV forecast rain. The wettest gauge, top gust and warmest and coldest places of the last 24 hours are pinned on the map where they happened. Below, Recent history covers rainfall, river levels, observations, the week's flood warnings and how wet the ground is, and Look ahead sets out the next five days: flood risk, warnings, rain and peak gusts from several models, the tides, and whether the models agree.
Ask about this page or the wider UK picture. Answers come from the site's data; check anything that matters.
Questions and answers may be read by people to improve the replies. How Bert works.
Town forecasts: ECMWF IFS and Met Office UKV via
Open-Meteo open data;
places from GeoNames. Both
CC BY 4.0.
Please do not include personal or sensitive information.
info
About Flood Forecast
This application brings together real-time data from multiple sources to help you stay
informed about weather and flood conditions across the UK.
report_problem
Important
This application is unofficial and provided for informational, research, and analysis purposes only. Uptime, data completeness, and real-time accuracy are not guaranteed.
To avoid over-reliance during active weather or flood events, do not make safety-critical decisions using this tool. For official warnings and instructions, consult the primary public services directly:
Google Analytics is used to see which pages are useful and where the site is slow. It's off until you say otherwise, and your choice is remembered. Nothing else on this site sets non-essential cookies, and advertising or personalisation cookies are never allowed.
Analytics is currently on.
You can change this at any time from the Cookie preferences link in the page footer.
 Open Radar & Sat