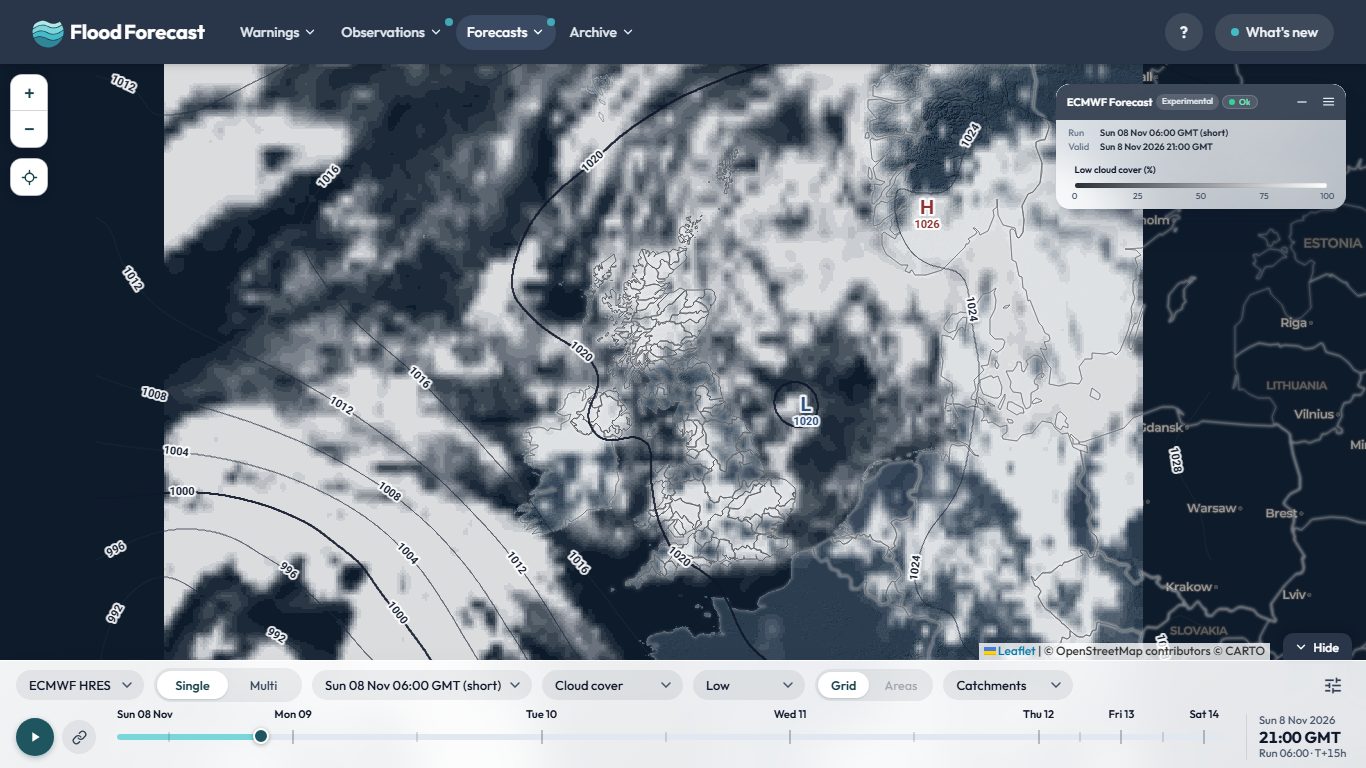
Overview terrain: AWS Terrain Tiles (SRTM, GMTED2010, ETOPO1 and others). Cloud, rain and isobars are the model's own.
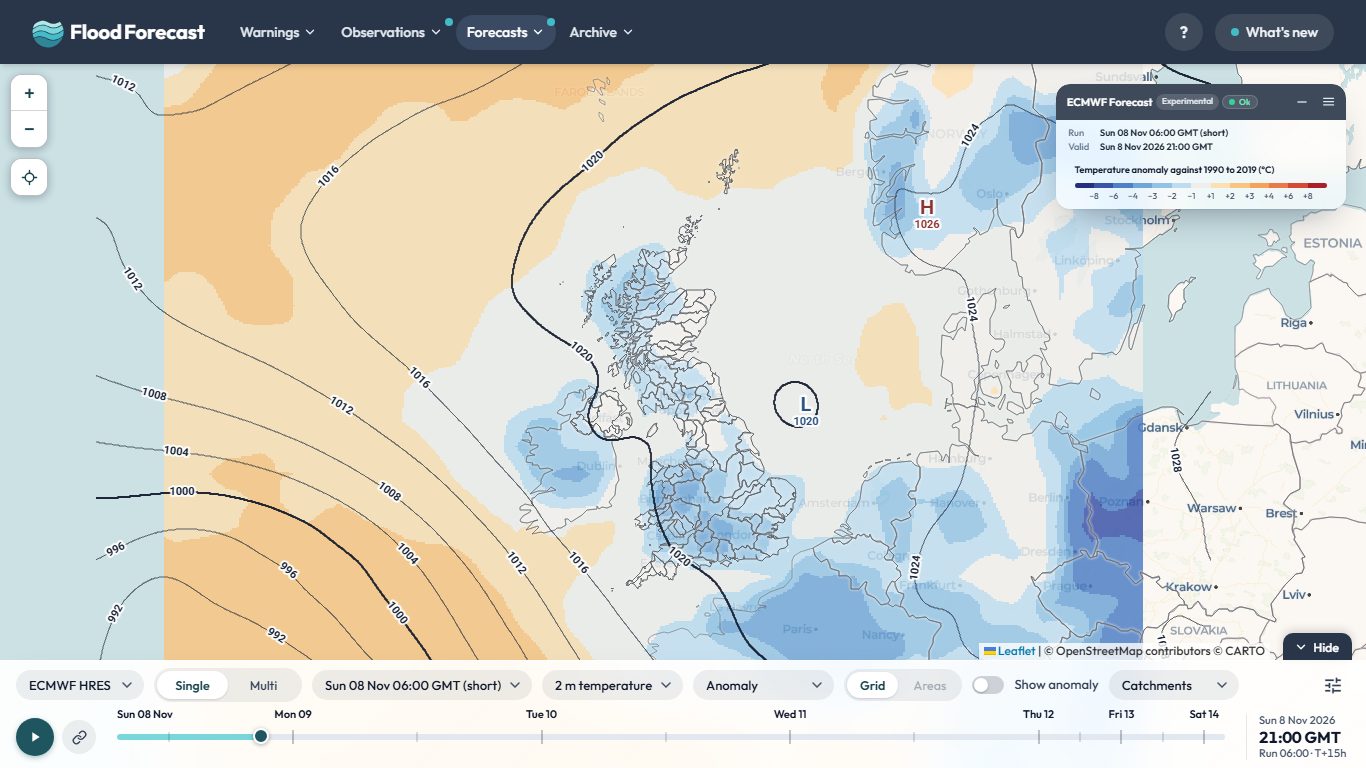
Temperature anomaly: the model's 2 m temperature less the 1990 to 2019 normal for that date and hour (ERA5, Copernicus Climate Change Service, set to the Met Office HadUK-Grid 1991 to 2020 monthly averages over the UK).
About this data
Météo-France AROME forecast:Météo-France AROME France HD (about 1 km), Open Licence 2.0 (Etalab), via Open-Meteo (open-meteo.com) Open Data
Model runs:Eight runs a day, every three hours from 00 GMT, each becoming available about four hours after its nominal time and reaching T+51 hours in hourly steps. AROME is the Météo-France model run on a grid of about 1km, fine enough to resolve showers and the effect of hills. Its area stops near 55.4N, so it covers Ireland, Wales and England up to the Scottish border but not Scotland. Areas that are not wholly inside it have no value, and the map says so rather than showing a partial figure. It publishes no pressure field, so there are no isobars.
Trial pipeline: this feed is built by a second, newer data pipeline (a small always-on server rather than the site's usual scheduled jobs), run alongside the existing one to see how well it holds up. The freshness dot above shows how old its newest data is.
Deterministic, not a probability: this is a single model solution, so it shows one possible outcome rather than a range. Treat it as guidance on pattern and timing, not as a forecast of exact totals at a place.
Comparing models: all seven render to the same map extent with the same colour scale, so a colour means the same millimetres whichever is selected. Differences you see between them are the models disagreeing, not the maps being drawn differently.
Isobars (MSLP): on by default, drawn as pressure lines over the rainfall; switch them off behind the settings button on the controls bar (or on the bar itself, on a wide enough screen). H/L pressure centres are labelled with their central pressure in hPa.
More for this model:
Catchment boundaries: National River Flow Archive (2014). NERC Environmental Information Data Centre. doi:10.5285/1957166d.
The address of the Model Viewer and Model Multi now follows what is on screen: the layer, Areas, isobars, temperature values, split screen and the rest. Bookmark it, or save it as a shortcut, and it opens the same view at the latest run. For a quick link to one parameter, add ?param=rain (or temp, cloud, wind) to the address.
The Cloud layer now shows white cloud over a darker map, so it stands out clearly, and you can switch between Total, High, Mid and Low cloud to see which layer of the atmosphere the cloud is in. It works on every model on the Model Viewer and Model Multi.
Temperature on the Model Viewer is now drawn in 3 degree colour bands, and a new Anomaly layer shows how far each model's 2 m temperature is above or below the normal for that date and hour, against 1990 to 2019 (set to the Met Office's 1991 to 2020 averages over the UK), in blue to red bands. Turn on Show temperature values in the settings menu to print the numbers on the map. Tap Space to flip between temperature and anomaly, or hold it to peek. The Split screen switch on the bar shows temperature on the left and its anomaly on the right.
This application brings together real-time data from multiple sources to help you stay
informed about weather and flood conditions across the UK.
report_problem
Important
This application is unofficial and provided for informational, research, and analysis purposes only. Uptime, data completeness, and real-time accuracy are not guaranteed.
To avoid over-reliance during active weather or flood events, do not make safety-critical decisions using this tool. For official warnings and instructions, consult the primary public services directly:
Google Analytics is used to see which pages are useful and where the site is slow. It's off until you say otherwise, and your choice is remembered. Nothing else on this site sets non-essential cookies, and advertising or personalisation cookies are never allowed.
Analytics is currently on.
You can change this at any time from the Cookie preferences link in the page footer.