This shows the latest issued Flood Outlook. This is a longer-range guidance forecast provided by the
Flood Forecasting Centre
to support strategic decision-making over a 6 to 30-day timescale, assessing expected flood likelihood at a national scale for England and Wales. It is typically issued twice a month. Contains public sector information licensed under the Open Government Licence v3.0.
The first page of the latest issued Flood Outlook PDF is displayed below. The full document can be opened or downloaded using the buttons.
Important note
This website is not operationally supported.
The official Flood Outlook user guide is available here. Supported sign up and delivery of the FGS is here.
Every named storm now has its own replay page: wind, gusts, pressure and rain hour by hour, with the track of the low and the Met Office warnings from 2020. Start the story and step through it in chapters with Next and Back: a title card that ranks the storm against all the others, each key moment zoomed to where it happened and to where the low was, and an end card that leads on to the next storm. Below, see the whole storm in three maps: rain gauge totals, radar rainfall and the strongest gusts.
Storm pages now carry two short films of the whole storm to save or share. Rainfall follows the rain over the UK on radar, with the low and its track. Wind and pressure follows the gusts across the Atlantic, with isobars and the low. Each runs about 50 seconds, slows over the UK impact days and ends on the storm's totals. They are being added to the storms one by one.
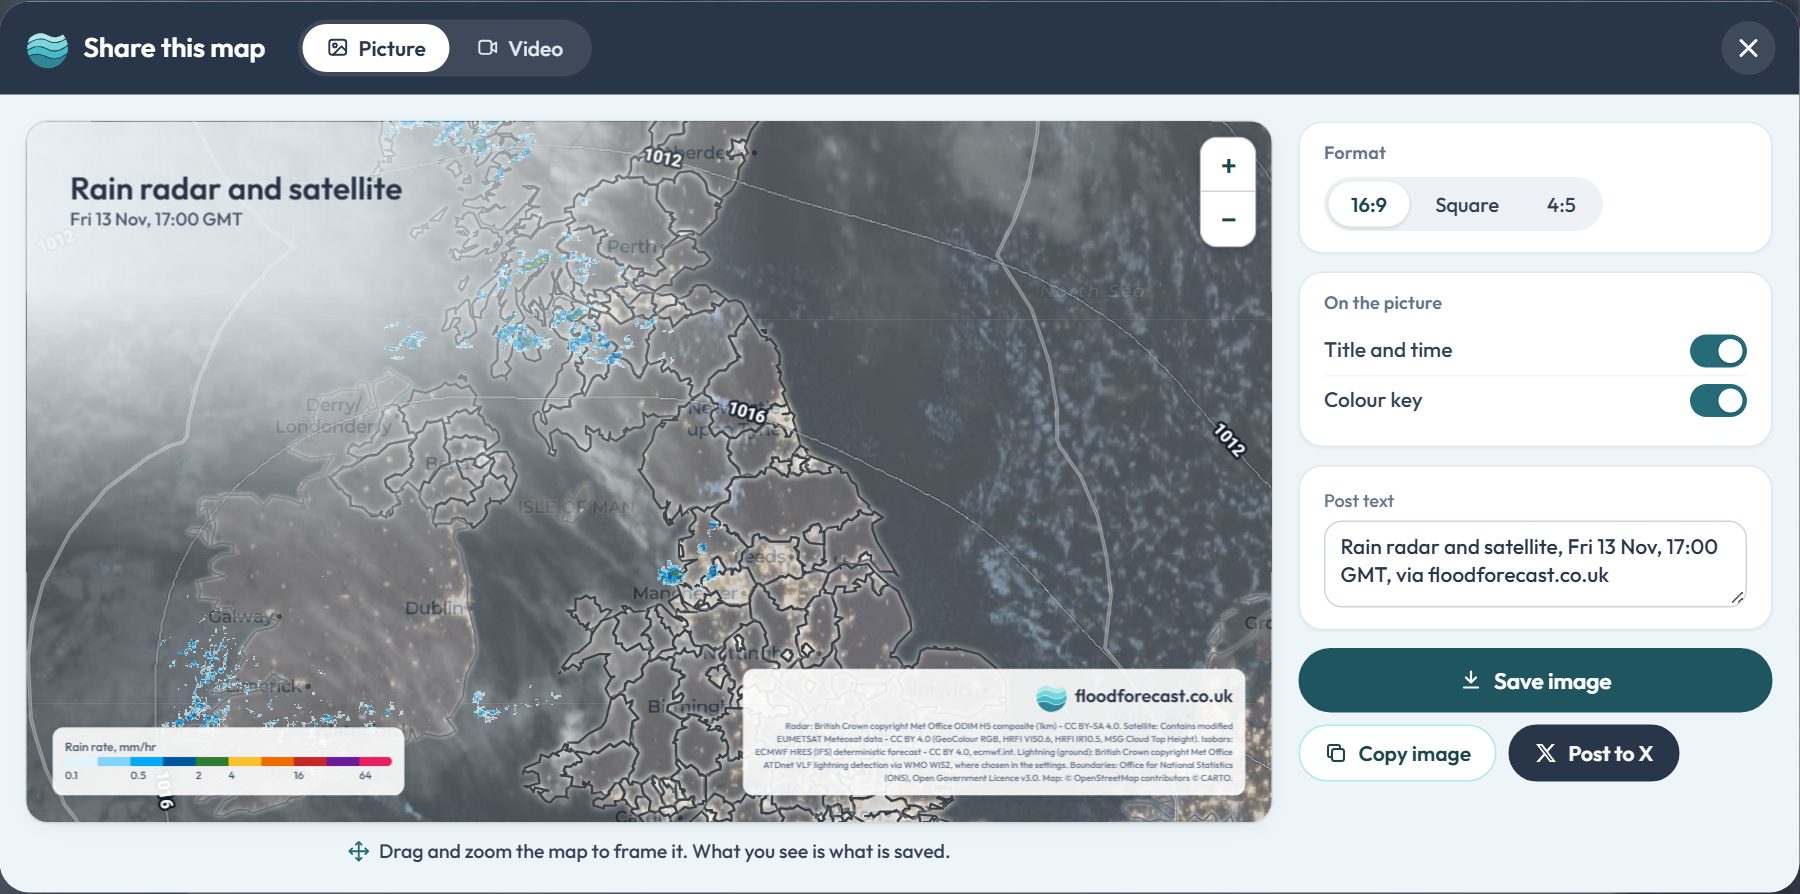
The Share button on the map pages makes a ready-to-post picture of the map, with its title, time, colour key and data credits. Drag and zoom to frame it, then pick wide, square or tall. On the radar, model and radar rainfall maps it can also turn the loop into a short video, played six times over so it runs on in a feed. Post to X straight from it, or use your phone's share menu.
Ask about this page or the wider UK picture. Answers come from the site's data; check anything that matters.
Questions and answers may be read by people to improve the replies. How Bert works.
Town forecasts: ECMWF IFS and Met Office UKV via
Open-Meteo open data;
places from GeoNames. Both
CC BY 4.0.
Please do not include personal or sensitive information.
Share this map
Drag and zoom the map to frame it. What you see is what is saved.
Format
On the picture
Loop
Up to 30 seconds.
info
About Flood Forecast
This application brings together real-time data from multiple sources to help you stay
informed about weather and flood conditions across the UK.
report_problem
Important
This application is unofficial and provided for informational, research, and analysis purposes only. Uptime, data completeness, and real-time accuracy are not guaranteed.
To avoid over-reliance during active weather or flood events, do not make safety-critical decisions using this tool. For official warnings and instructions, consult the primary public services directly:
Google Analytics is used to see which pages are useful and where the site is slow. It's off until you say otherwise, and your choice is remembered. Nothing else on this site sets non-essential cookies, and advertising or personalisation cookies are never allowed.
Analytics is currently on.
You can change this at any time from the Cookie preferences link in the page footer.
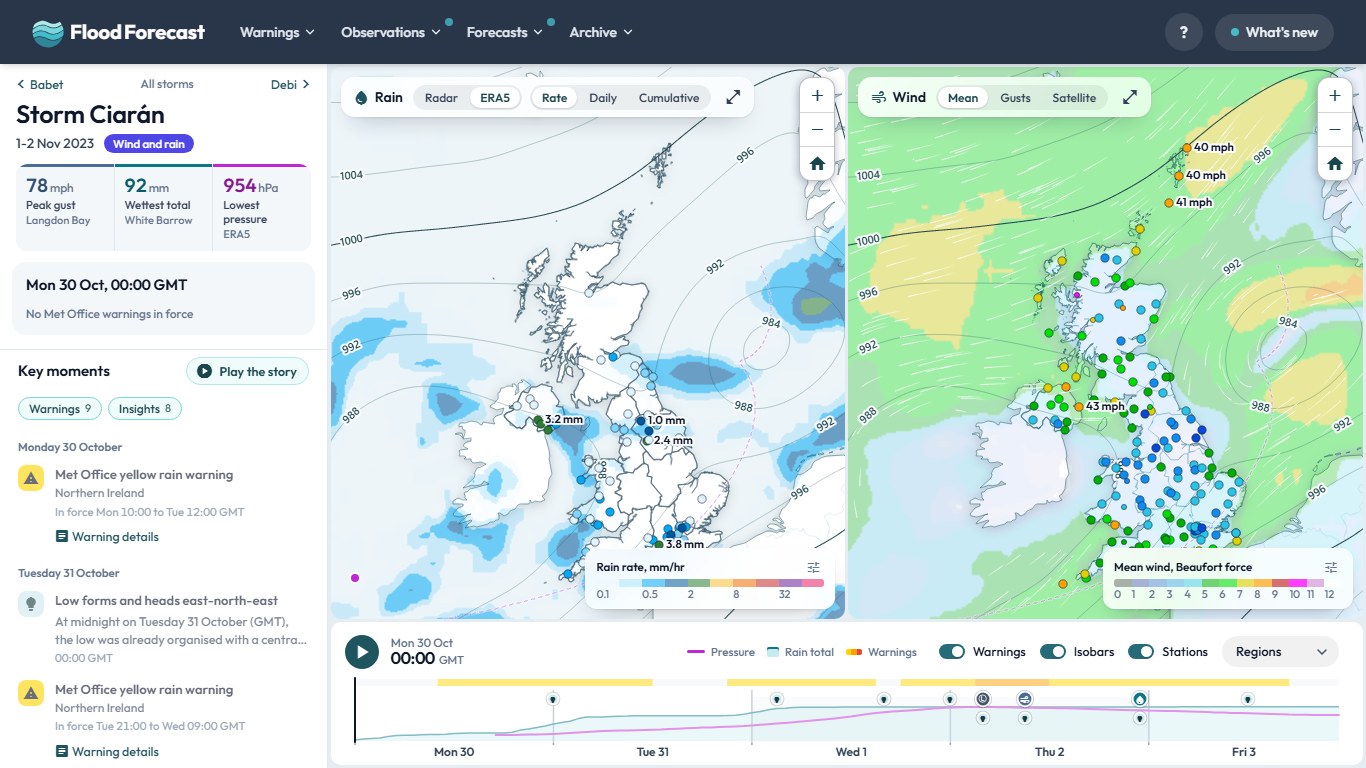 Browse the storms