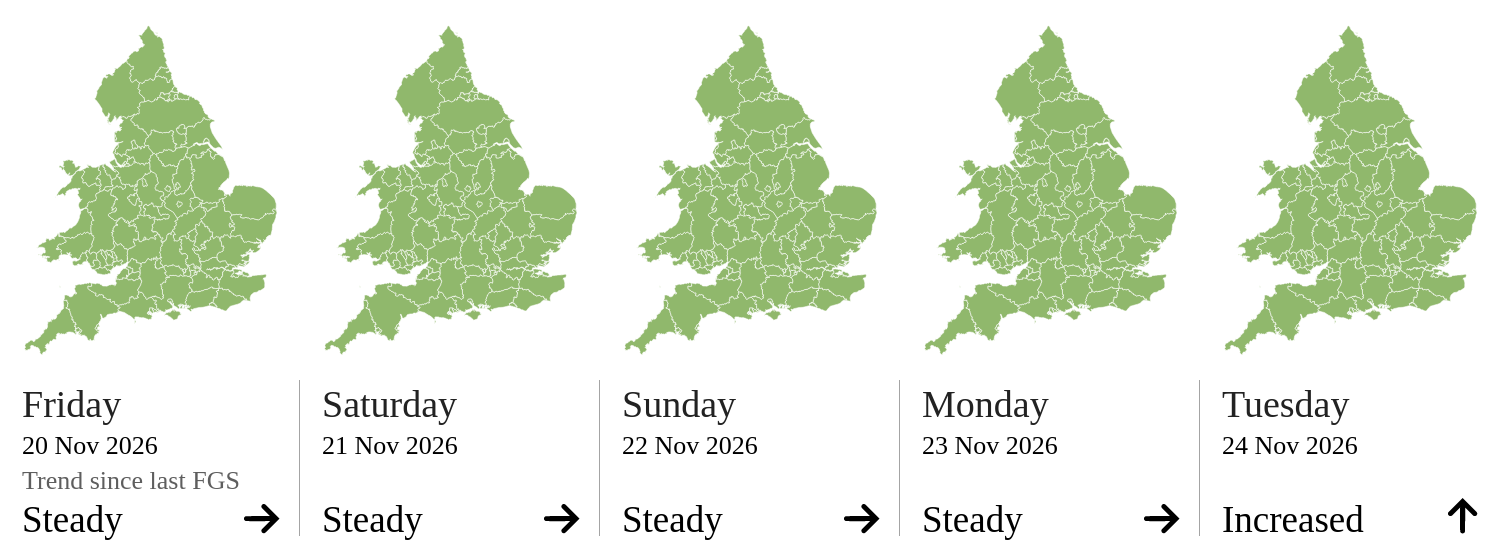
Flood Guidance Statement maps you can explore
The five day risk maps are now live county maps. Zoom, pan and hover any county to see which sources are behind its colour, switch between river, surface water, coastal and groundwater, and open any statement in the 90 day table as a small map. The statistics below are new too: how unusual today is, how long since each level last happened, and which counties are named most often.
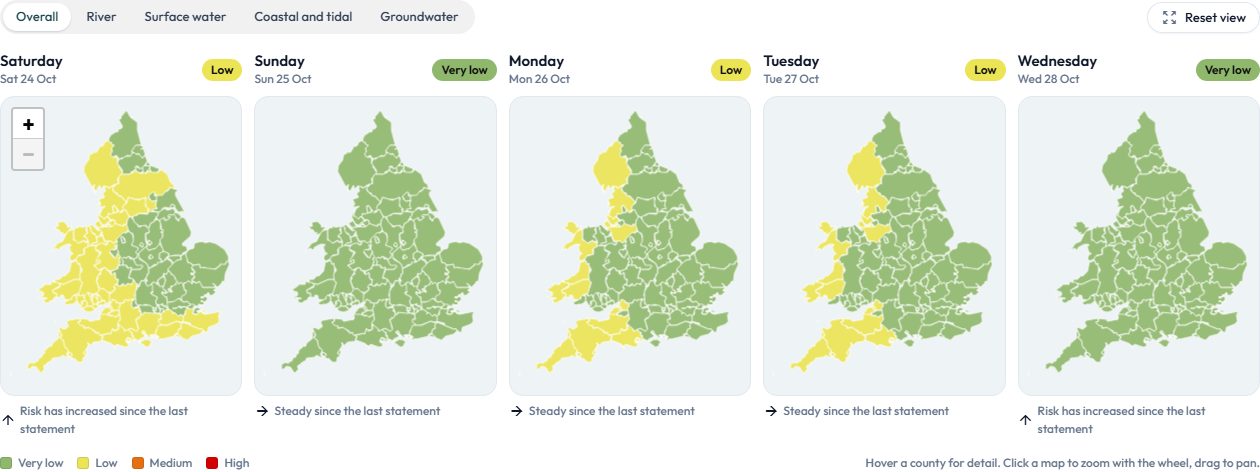 Open the Flood Guidance Statement
Useful?
Thanks