New names on the impact matrix

October 2026

The Flood Forecasting Centre, the Met Office and the UK's environment agencies now share one impact matrix, so flood guidance and weather warnings use the same words.

Impact Minimal→Minor Minor→Moderate Significant Severe→Extreme
Likelihood Very low→Low Low→Medium Medium→High High→Very high

Colours and overall flood risk levels are unchanged. This site uses the new names throughout, but the text inside older statements keeps the words used when it was issued.

Flood Guidance Statement, 30 December 2017

Issued at
Saturday 30 Dec 2017, 10:30 GMT
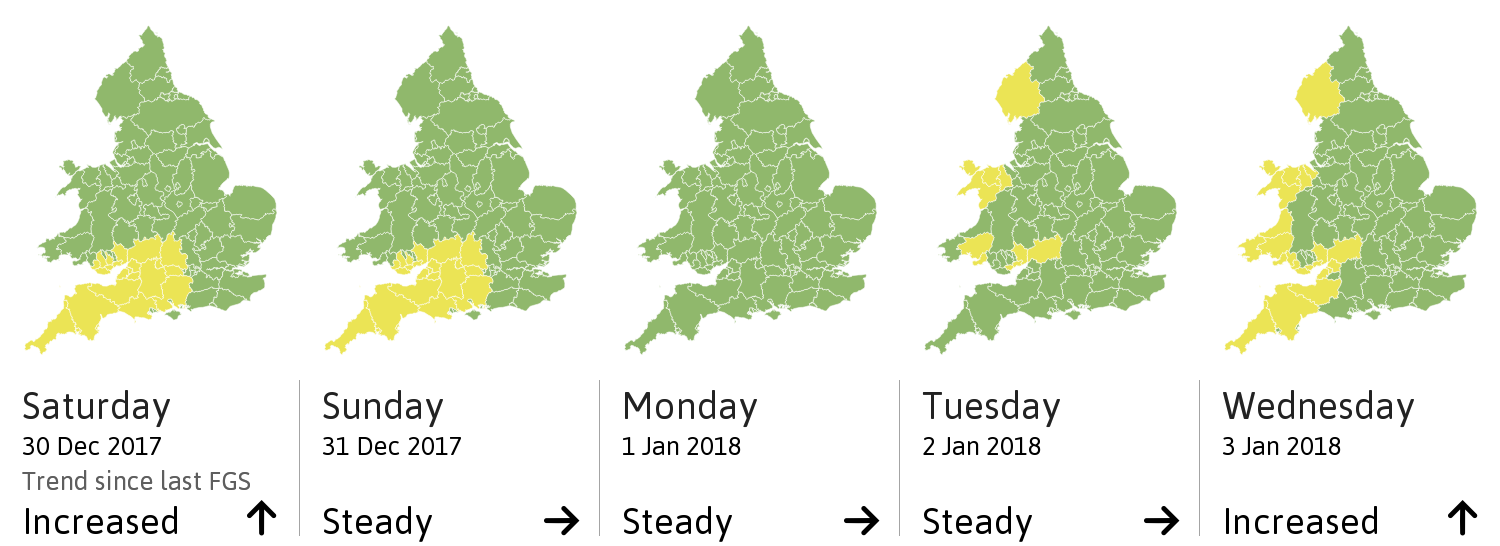
Overall flood risk Low
Highest impact Significant

campaign Headline

Significant coastal flooding impacts are possible but not expected for parts of western England and Wales on Tuesday and Wednesday. Minor surface water flooding impacts are probable for south-west England and south-east Wales today and tomorrow.

format_list_bulleted Breakdown by source

Source Overall flood risk Highest impact
River Very Low Moderate
Surface Water Low Moderate
Groundwater Very Low Minor
Coastal/Tidal Low Significant

calendar_month 6-10 Day Forecast

Spring tides remain high into the end of next week and further unsettled weather is expected. This brings the potential for further coastal flooding impacts. Localised river and surface flooding impacts are also possible at times.

About the Flood Guidance Statement

The Flood Guidance Statement is issued every day by the Flood Forecasting Centre, a partnership of the Environment Agency and the Met Office. It sets out the risk of flooding across England and Wales over the next five days from four sources: rivers, surface water, groundwater and the sea.

Each risk is very low, low, medium or high, and combines how likely flooding is with how severe its impacts could be. The statement is written for emergency responders; for flood warnings where you live, use the GOV.UK flood warning service in England or Natural Resources Wales in Wales.

Every statement is kept in the archive, and the calendars and statistics show how often each level of risk has been reached.