Total rain for an area, or several added together. The dark line is what radar measured. Each forecast run starts from what had already fallen by its run time, so past runs show how they did and the newest show what is still to come.
Compare
Runs
Models
Show ahead
Rain since the chart starts
Times are GMT.
Loading…
Line
Total shown
Forecast so far
Radar, same hours
Difference
Area
Pick two or more to treat them as one area. Or click areas on the map.
Radar: British Crown copyright Met Office ODIM H5 composite (1km) - CC BY-SA 4.0.
DMI Harmonie: DMI HARMONIE-AROME Europe 2 km deterministic – Danish Meteorological Institute (DMI), CC BY 4.0, via Open-Meteo Open Data
Météo-France AROME: Météo-France AROME France HD (about 1 km), Open Licence 2.0 (Etalab), via Open-Meteo (open-meteo.com) Open Data
ECMWF HRES: ECMWF HRES (IFS) deterministic forecast – CC BY 4.0, ecmwf.int
ECMWF AIFS: ECMWF AIFS Single 0.25° deterministic (machine-learned forecast model) – CC BY 4.0, ecmwf.int, via Open-Meteo Open Data
NOAA GFS: NOAA Global Forecast System (GFS) 0.13° deterministic (precipitation) + 0.25° (MSLP) – U.S. Government work, public domain, via Open-Meteo Open Data
NOAA AIGFS: NOAA AIGFS 0.25° deterministic (machine-learned forecast model) – U.S. Government work, public domain, via Open-Meteo Open Data
Met Office Global: Met Office Global (Unified Model) 10km deterministic – British Crown copyright Met Office, via Open-Meteo Open Data – CC BY-SA 4.0
Boundaries: ONS, Open Government Licence v3.0. Catchments: National River Flow Archive (2014). NERC Environmental Information Data Centre. doi:10.5285/1957166d.
The address of the Model Viewer and Model Multi now follows what is on screen: the layer, Areas, isobars, temperature values, split screen and the rest. Bookmark it, or save it as a shortcut, and it opens the same view at the latest run. For a quick link to one parameter, add ?param=rain (or temp, cloud, wind) to the address.
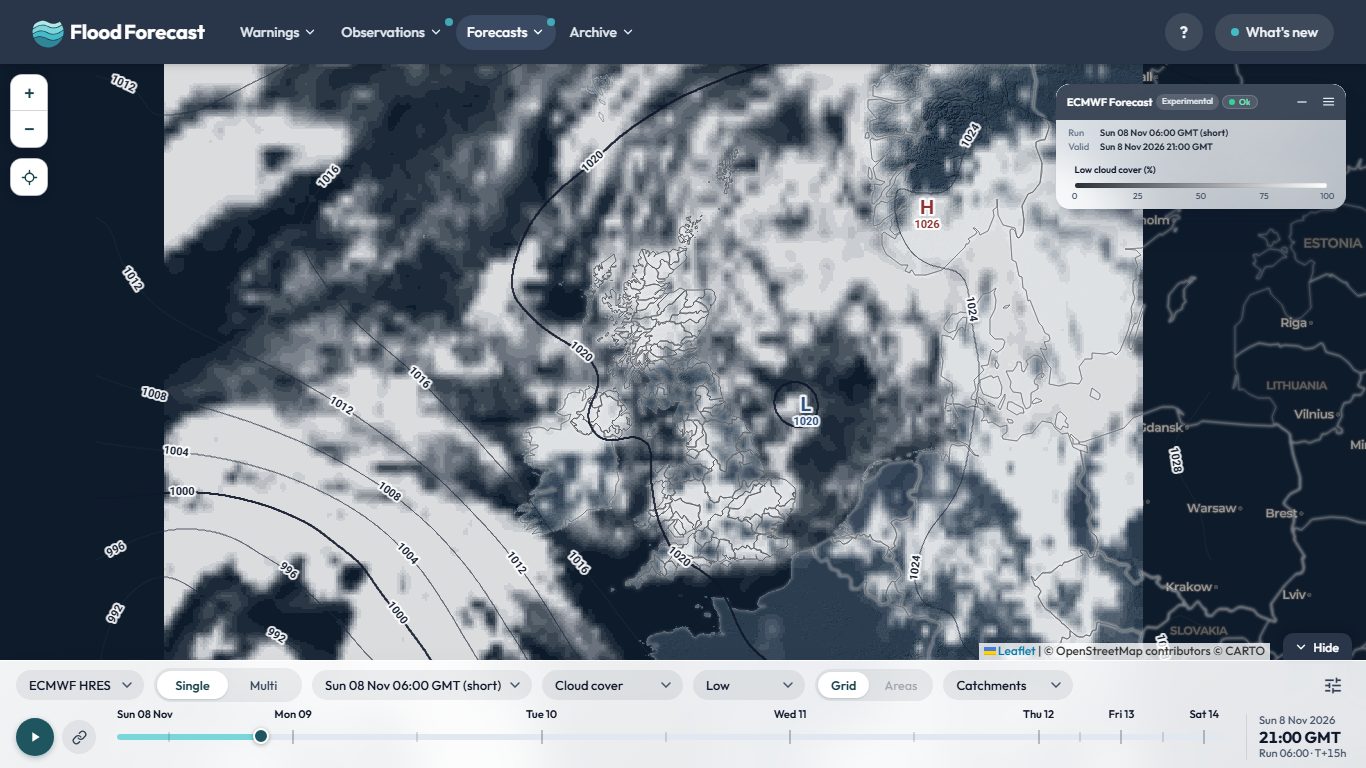
The Cloud layer now shows white cloud over a darker map, so it stands out clearly, and you can switch between Total, High, Mid and Low cloud to see which layer of the atmosphere the cloud is in. It works on every model on the Model Viewer and Model Multi.
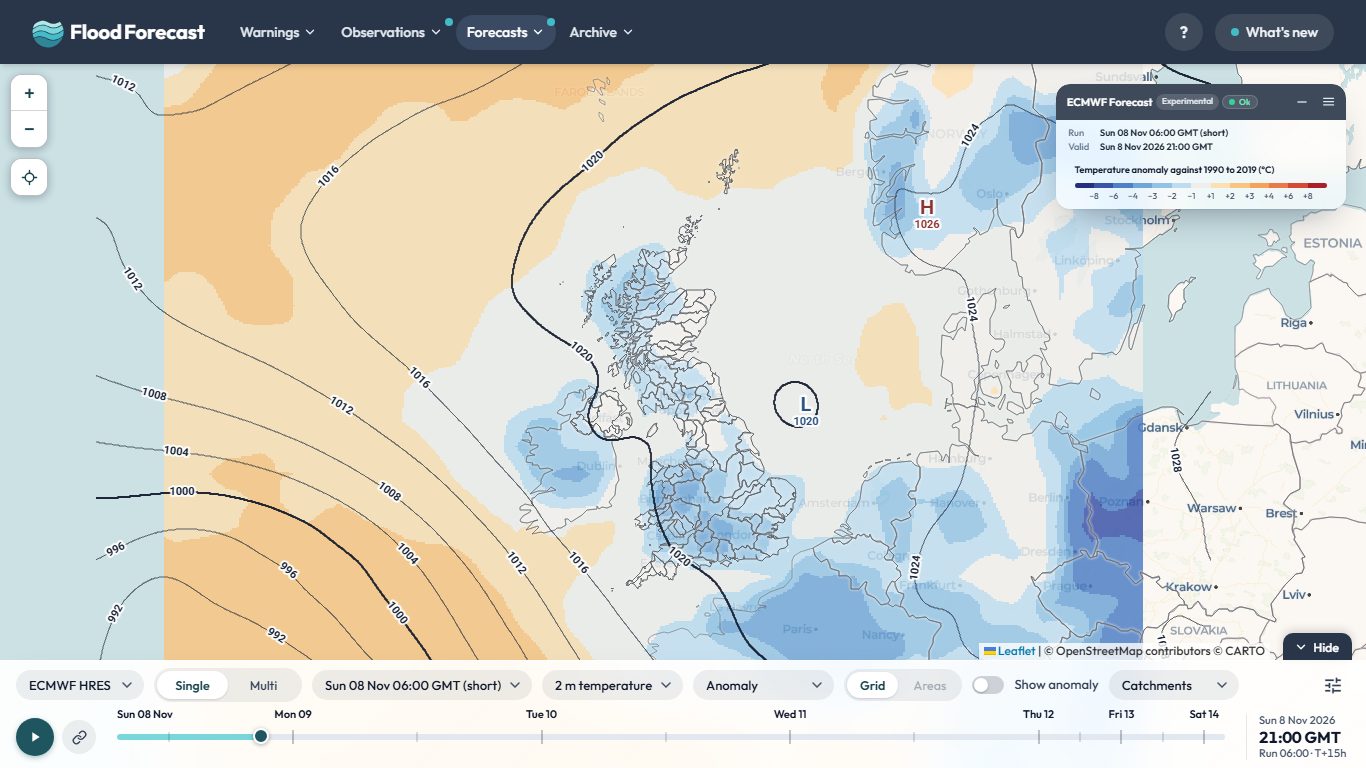
Temperature on the Model Viewer is now drawn in 3 degree colour bands, and a new Anomaly layer shows how far each model's 2 m temperature is above or below the normal for that date and hour, against 1990 to 2019 (set to the Met Office's 1991 to 2020 averages over the UK), in blue to red bands. Turn on Show temperature values in the settings menu to print the numbers on the map. Tap Space to flip between temperature and anomaly, or hold it to peek. The Split screen switch on the bar shows temperature on the left and its anomaly on the right.
Ask about this page or the wider UK picture. Answers come from the site's data; check anything that matters.
Questions and answers may be read by people to improve the replies. How Bert works.
Town forecasts: ECMWF IFS and Met Office UKV via
Open-Meteo open data;
places from GeoNames. Both
CC BY 4.0.
Please do not include personal or sensitive information.
info
About Flood Forecast
This application brings together real-time data from multiple sources to help you stay
informed about weather and flood conditions across the UK.
report_problem
Important
This application is unofficial and provided for informational, research, and analysis purposes only. Uptime, data completeness, and real-time accuracy are not guaranteed.
To avoid over-reliance during active weather or flood events, do not make safety-critical decisions using this tool. For official warnings and instructions, consult the primary public services directly:
Google Analytics is used to see which pages are useful and where the site is slow. It's off until you say otherwise, and your choice is remembered. Nothing else on this site sets non-essential cookies, and advertising or personalisation cookies are never allowed.
Analytics is currently on.
You can change this at any time from the Cookie preferences link in the page footer.