Overview
Real-time flood risk across England, Wales & Scotland
AI generated
Live Flood Warnings
E&W England & Wales
Flood Guidance Statement
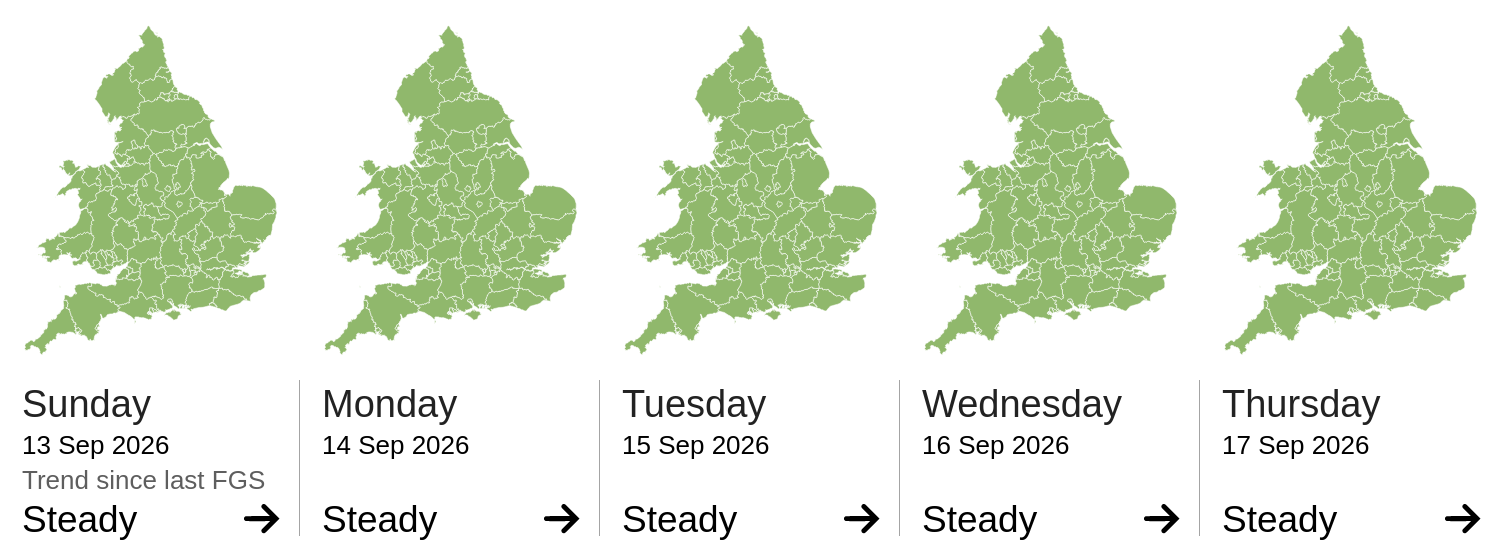
The overall flood risk for England and Wales is VERY LOW for the next five days.
Breakdown by source
| Source | Overall flood risk | Highest impact |
|---|---|---|
| River | Very Low | Minimal |
| Surface Water | Very Low | Minimal |
| Groundwater | Very Low | Minimal |
| Coastal/Tidal | Very Low | Minimal |
Rapid Flood Guidance
Issued when flash flooding is considered likely within the next few hours.
Met Office Warnings
Checking…
Tidal Cycle
Spring tides running, easing, 2 days past peak.
| Period | Peak | Rank | Size | Height |
|---|---|---|---|---|
| Sat 26 Sep–Fri 2 Oct | Tue 29 Sep | 6th/25 | Large | 9.76m |
| Thu 8–Mon 12 Oct | Sat 10 Oct | 15th/25 | Moderate | 9.61m |
| Sat 24–Fri 30 Oct | Tue 27 Oct | 5th/25 | Large | 9.78m |
| Mon 9–Wed 11 Nov | Tue 10 Nov | 21st/25 | Small | 9.22m |
| Mon 23–Fri 27 Nov | Wed 25 Nov | 13th/25 | Moderate | 9.64m |
Liverpool (Gladstone Dock) tide predictions from the National Tidal & Sea Level Facility (NTSLF), National Oceanography Centre. Spring periods are centred on the highest predicted high water in each lunar cycle; the shaded window varies with spring size (1–3 days either side). At Liverpool high waters reach ~9–10m during large springs and ~7.5m at neaps. Size (small / moderate / large) and rank are relative to all springs in the peak's own calendar year — dates carry their year whenever it isn't 2026, since a spring's rank is never comparable across the year boundary.
Flood Outlook
6–30 day outlook
Issued by the Flood Forecasting Centre. Assesses national flood likelihood on a 6–30 day horizon, typically twice monthly.
24hr Rainfall Accumulation
Rolling 24-hour total to time shown
Rainfall (mm)
Surface Pressure Analysis
Surface pressure, early frames of successive GFS runs